What the EU ETS and CBAM Outlook Means for Indian Business and How to Respond
Based on Argus EU ETS and CBAM Outlook, Issue 26-2 | June 2026
01 Executive Summary
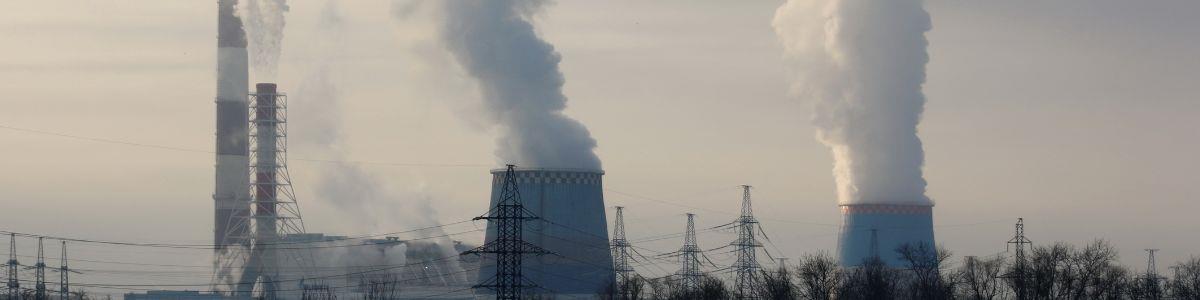
The EU Emissions Trading System (ETS) is entering a sustained upward price cycle, with allowances forecast to rise from 75/t today toward 95/t by late 2027. The Carbon Border Adjustment Mechanism (CBAM), now fully in its transitional phase, is no longer a future risk it is a present cost for any Indian company exporting steel, aluminium, fertilisers, cement, or hydrogen to the European Union.
This blog draws on the Argus EU ETS and CBAM Outlook (Issue 26-2, June 2026) to quantify the exposure facing Indian industry and then lays out a clear, actionable mitigation framework, including the often-misunderstood but genuinely promising role of the Voluntary Carbon Market (VCM).
EU ETS spot (May 2026)
75.11/t
Actual assessed price
Q4 2026 central forecast
83.83/t
? 5.85 vs prior forecast
End-2027 forecast
~95/t
Rising as cap tightens
Indian steel CBAM cost
252/t
Highest among all origins
Key takeaway
Indian businesses exporting to the EU must act now: measure actual emissions, engage with India's Carbon Credit Trading Scheme, begin capital planning for process decarbonisation, and explore VCM credit generation as a financing bridge. The July 15, 2026 EU ETS review is the most consequential near-term event to monitor.
02 The Argus EU ETS & CBAM Outlook: What the Report Says
ETS Price Outlook: Rising and Unlikely to Reverse
After months of range-bound trading at 7075/t through early 2026, EU carbon allowances closed May at 75.11/t and the Argus central forecast now calls for a meaningful upward move. Prices are expected to average 7680/t over the summer before rising into 85/t through September, driven by compliance-deadline buying ahead of the 30 September deadline. A post-compliance dip in October is forecast to be followed by further tightening through year-end.
Period
Central forecast (/t)
vs. prior forecast
Key driver
May 2026 actual
75.11
Range-bound, policy uncertainty
Jun 2026
76.10
+1.21
Social Climate Fund auctions absorbed
Aug 2026
80.00
+3.89
Pre-compliance buying pressure
Sep 2026
85.00
+8.48
Compliance deadline, allocation delays
Q4 2026
83.83
+5.85
Post-compliance recovery
End 2027
~95.67
+11.11
Cap tightening, MSR absorption
Three key near-term risk factors
Allocation uncertainty Free allocation benchmark dispute: Czech-led coalition of 8 member states seeking to freeze benchmark values at 202125 levels. Any delay to issuance increases compliance-driven buying, pushing prices up.
July 15 policy event EC ETS review proposals on 15 July 2026 will address supply cap reduction pace, free allocation extension, and Market Stability Reserve adjustments. Outcome could be significantly more or less accommodative than market consensus.
Geopolitical wildcard Strait of Hormuz blockade continues to suppress risk-on sentiment. Resolution would bring investors back to the market, lifting ETS prices materially.
CBAM: The Mechanism Translating ETS Prices into Export Costs
The Carbon Border Adjustment Mechanism charges importers of covered goods into the EU for the embedded carbon content of those goods, at the prevailing EU ETS price. Default values set conservatively high by the EU apply unless producers submit verified actual emissions data. The CBAM cost rises in direct proportion to ETS prices, making the upward price trajectory above a compounding concern for Indian exporters.
How CBAM is calculated
CBAM cost = embedded emissions (t CO2e per tonne of product) EU ETS prompt price. The EU uses default values per country, product, and production pathway including mark-ups as defined in EC Implementing Regulation 2025/2621. Producers can substitute verified actual emissions to reduce their liability.
03 Impact on Indian Businesses
India's industrial base particularly in steel and aluminium is built around coal-intensive processes. This structural reality means Indian exporters face among the highest CBAM default values of any major exporting nation. The comparison with competitors is stark.
Steel: The Most Exposed Sector
Country of origin
Q2 2026 CBAM cost (/t)
Q3 2026
Jan 2027
Production method
India
251.31
272.73
334.35
Coal blast furnace (BF-BOF)
China
160.90
174.62
218.94
BF-BOF, some scrap
Vietnam
93.68
101.66
133.12
Mixed BF / EAF
Turkey
90.37
98.07
128.90
EAF (scrap-based)
Brazil
32.92
35.73
55.57
EAF + hydropower grid
South Korea
74.67
81.03
108.86
Integrated with efficiency gains
The Brazil benchmark
Brazil's CBAM cost (33/t in Q2 2026) is roughly 1/8th of India's (252/t). The difference is almost entirely production method: Brazil uses Electric Arc Furnace steelmaking powered by a renewables-heavy grid. This is the destination Indian steel companies must navigate toward.
Aluminium: A Secondary Pressure Point
India's aluminium smelters running predominantly on captive coal power attract CBAM default values comparable to UAE and Bahrain at ~50/t in Q2 2026. However, Gulf producers running on cheaper, lower-emission gas power, and particularly Qatar and Saudi Arabia at ~36/t, have a structural cost advantage that widens as ETS prices rise toward 95/t.
Country
Q2 2026 (/t)
Q3 2026 (/t)
Jan 2027 (/t)
India
49.97
54.24
77.92
UAE / Bahrain
49.97
54.24
77.92
Qatar / Saudi Arabia
36.02
39.09
60.10
China
142.75
154.92
196.35
South Africa
90.08
97.75
129.11
Hydrogen: Structurally Blocked Without Decarbonisation
India's grey hydrogen (produced from coal or gas via steam methane reforming) faces CBAM costs of ~775/t in Q2 2026 roughly 35% more than green-hydrogen-capable origins like Morocco, Brazil, or UAE (~513/t). By January 2027 India's cost rises to ~1,048/t, making EU hydrogen exports commercially impossible without a fundamental shift to green production pathways.
Origin
Q2 2026 CBAM cost (/t)
Jan 2027
Production type
India
774.69
1,048.21
Grey (coal / gas SMR)
Saudi Arabia
727.49
987.42
Grey / blue hybrid
Morocco / Brazil / UAE
513.45
711.77
Green (solar / hydro)
UK
513.45
711.77
Mixed grid
China
1,800.90
N/A
Coal-heavy
04 Mitigation Strategies for Indian Businesses
There is no single solution to CBAM exposure, but there is a clear hierarchy of interventions ranging from quick wins with no capital expenditure to long-horizon structural transformation. The most effective strategy combines all layers.
Layer 1: Immediate Actions (No Capital Required)
Submit verified actual emissions
CBAM default values are set conservatively high. Third-party verified actual emissions per EU Implementing Regulation 2025/2621 can replace defaults often significantly lower for companies that have already invested in efficiency. This should be the first action for every Indian exporter.
Highest near-term impact | Cost: low
Audit embedded carbon across supply chain
CBAM charges embedded carbon across the full value chain including upstream inputs. Switching to lower-emission raw materials (e.g. lower-carbon coking coal, or scrap as a partial charge) reduces the taxable base without a furnace replacement.
Quick win | Operational change only
Leverage India's carbon pricing (CCTS)
Any carbon price formally paid in the country of origin is directly deductible from CBAM liability under current EU rules. India's Carbon Credit Trading Scheme (CCTS), if it matures into a mandatory pricing mechanism, is the most powerful CBAM deduction route available.
Policy-dependent | Engage MNRE / MoEFCC now
Monitor July 15 EC review closely
The European Commission's ETS review proposals on 15 July 2026 will shape the supply cap trajectory, free allocation policy, and MSR adjustments for years ahead. A less-accommodative outcome than market consensus would push ETS prices and CBAM costs materially higher.
Risk management | Zero cost to monitor
Layer 2: Medium-Term Investment (13 Years)
Transition to Electric Arc Furnace (EAF) steelmaking
The single most impactful structural change for Indian steel exporters. EAF using scrap steel eliminates the blast furnace's embedded carbon burden. Brazil's CBAM cost of 33/t vs India's 252/t is almost entirely this difference. Capital cycle is 35 years feasibility studies must start now.
Highest structural impact | 35 year horizon
Captive renewable power for energy-intensive industries
Aluminium smelting and steel EAF both benefit enormously from low-carbon grid electricity. India's renewable capacity is world-class the gap is industrial captive use. Solar / wind PPAs for smelters can reduce embedded carbon intensity by 4060% depending on current grid mix.
High impact | 23 year implementation
Green hydrogen investment
For companies with EU hydrogen export ambitions, the production pathway must shift to electrolysis using renewable electricity. India's solar resource makes this economically viable over a 5-year horizon, and green hydrogen carries 35% lower CBAM costs than grey pathways today a gap that grows with ETS prices.
Long-horizon | Strategic positioning
Diversify exports away from EU
For products with very high near-term CBAM liability (grey hydrogen, high-emission steel), redirecting volumes to ASEAN, Middle East, and African markets which have no carbon border mechanism while decarbonising for EU re-entry is a pragmatic bridge strategy.
Commercial hedge | Immediate option
The most important decision of 2026
Indian steel companies that commission EAF feasibility studies in 2026 will be ready to invest in 202728 precisely when ETS prices are forecast to reach 9095/t and CBAM liability becomes a decisive competitive disadvantage. Companies that wait until 2028 to begin will miss the transition window and face a structural cost penalty for years.
05 How the Voluntary Carbon Market Can Help
The Voluntary Carbon Market (VCM) is frequently misunderstood in the context of CBAM sometimes overstated as a direct compliance tool, sometimes dismissed as irrelevant. The truth is more nuanced: the VCM cannot replace CBAM certificates, but it offers Indian businesses three genuinely valuable roles that, together, form a powerful part of the response strategy.
What the VCM Can and Cannot Do
Critical clarification
VCM credits (VCUs, Gold Standard credits) CANNOT directly substitute for CBAM certificates only EU ETS allowances serve that purpose under current regulation. The only direct CBAM deduction route is a carbon price paid under a formal domestic pricing scheme (tax or mandatory ETS). India's CCTS, if it matures appropriately, is the key mechanism here not VCM credits.
Role 1: Financing Decarbonisation Investment
Indian companies investing in emission reduction projects renewable energy installations, energy efficiency upgrades, methane capture, afforestation can generate and sell VCM credits on international markets. At $1030 per credit (higher for nature-based and high-integrity credits), a large industrial facility could generate meaningful revenue that helps fund the very capital investments that reduce CBAM liability.
Example: A 500MW captive solar installation at an aluminium smelter generating 400,000 t CO2e/year of avoided emissions could yield $412 million annually in VCM credit sales contributing meaningfully toward the capital cost of the renewable installation itself.
Role 2: Enabling Green Premium Pricing with EU Buyers
As ETS prices rise and CBAM becomes a material cost for EU importers, buyers increasingly prefer lower-emission supply sources and are willing to pay a green premium. Indian exporters with credible, third-party-verified decarbonisation stories supported by VCM project registration and credit issuance have a stronger commercial narrative than competitors relying on default emission claims.
This is particularly relevant in sectors where buyers are absorbing CBAM costs themselves (purchasing CBAM certificates on behalf of their supply chain) they will naturally favour suppliers who minimise that liability.
Role 3: Article 6 Bilateral Agreements The Emerging Pathway
Under Article 6.2 of the Paris Agreement, India can negotiate bilateral Internationally Transferred Mitigation Outcome (ITMO) agreements with EU member states or the EU bloc itself. Credits transferred under Article 6.2 receive a Corresponding Adjustment making them internationally recognised and deducted from India's NDC accounting.
While not yet formally connected to CBAM deduction frameworks, Article 6.2 pathways are the most credible route toward a future mechanism where Indian emission reductions could formally offset CBAM liability. India's engagement through MNRE and MoEFCC on bilateral ITMO agreements should be treated as a strategic priority.
India's VCM Advantage: Where Credits Can Be Generated
Forestry
India's active reforestation programs can generate high-quality nature-based credits. These command premium prices ($3540+) from EU corporates using them for Scope 3 offsetting, and have strong co-benefit narratives (biodiversity, community livelihoods).
High credit value | Immediate eligibility
Renewable energy projects
Solar and wind projects operating against India's coal-heavy grid baseline (emission factor ~0.71 t CO2/MWh) generate significant avoided-emission credits under Verra VCS and Gold Standard methodologies. Industrial captive installations are particularly well-positioned.
High volume | Established methodology
Industrial methane & waste
Coal mine methane capture, steel slag valorisation, and agricultural waste-to-energy projects generate high-GWP avoided emissions. Methane has 28x the warming potential of CO2, making these projects credit-rich relative to investment cost.
Premium pricing | High GWP multiplier
Cookstove & rural energy
Improved cookstove distribution and rural solar electrification generate both carbon credits and SDG co-benefits that attract premium voluntary buyers. India has established methodologies and large-scale project precedent through CDM history.
SDG premium | Established track record
The VCMCBAM Connection: A Summary
VCM role
Mechanism
Benefit to Indian business
Maturity
Financing bridge
Sell credits generated from emission reductions
Revenue funds decarbonisation CapEx that lowers CBAM
Available now
Green premium
Verified credentials signal low-emission supply
EU buyers prefer and pay more for lower-liability suppliers
Available now
CCTS linkage
India domestic carbon price deductible under CBAM
Direct CBAM liability reduction if CCTS becomes mandatory
12 years
Article 6.2 ITMOs
Bilateral ITMO agreements with EU counterparts
Future formal CBAM deduction pathway
35 years
06 Recommended Action Roadmap
The following sequence represents the highest-ROI order of actions for Indian businesses exporting to the EU. Early steps require minimal capital; later steps build on them.
Horizon
Priority action
Expected outcome
Now Q3 2026
Commission third-party actual emissions verification (ISO 14064 / EU-compliant)
Replace default CBAM values immediate cost reduction possible
Now Q3 2026
Monitor EC ETS review on July 15; engage trade associations to track CBAM scope changes
Understand medium-term regulatory direction before investment decisions
Revenue stream to fund decarbonisation; green premium narrative
Q4 2026 2027
Engage with MNRE / MoEFCC on CCTS participation and Article 6.2 ITMO agenda
Policy preparation for CBAM deduction mechanisms; bilateral agreements
2027
Invest in process decarbonisation EAF feasibility, captive renewables PPA, green H2 pilots
Structural CBAM cost reduction; competitive repositioning in EU market
20272028
Pursue Article 6.2 bilateral ITMO agreements with EU partners through government channels
Foundation for future formal CBAM-VCM linkage mechanism
2028+
Compete as a low-carbon supplier CBAM becomes a competitive advantage vs. non-decarbonised peers
Market share gains; premium pricing; sustainable EU trade relationship
Final word
The CBAM is not going away it is going to tighten. Indian businesses that treat it as a compliance cost to minimise rather than a market signal to respond to will find themselves progressively squeezed out of EU markets as prices rise toward 100/t and beyond. The companies that invest in verifiable decarbonisation now supported by VCM revenues, government policy engagement, and process innovation will not just survive CBAM. They will use it as a moat against higher-emission competitors.
Source: Argus EU ETS and CBAM Outlook, Issue 26-2, 4 June 2026 (Argus Media Group). Price forecasts and CBAM cost calculations are reproduced for analytical purposes. All rights reserved by Argus Media.
Disclaimer: This analysis is for informational purposes only and does not constitute financial, legal, or regulatory advice. Businesses should consult qualified advisors before making investment or compliance decisions.
Subscribe to our newsletter and recieve a selection of our cool articles every week.